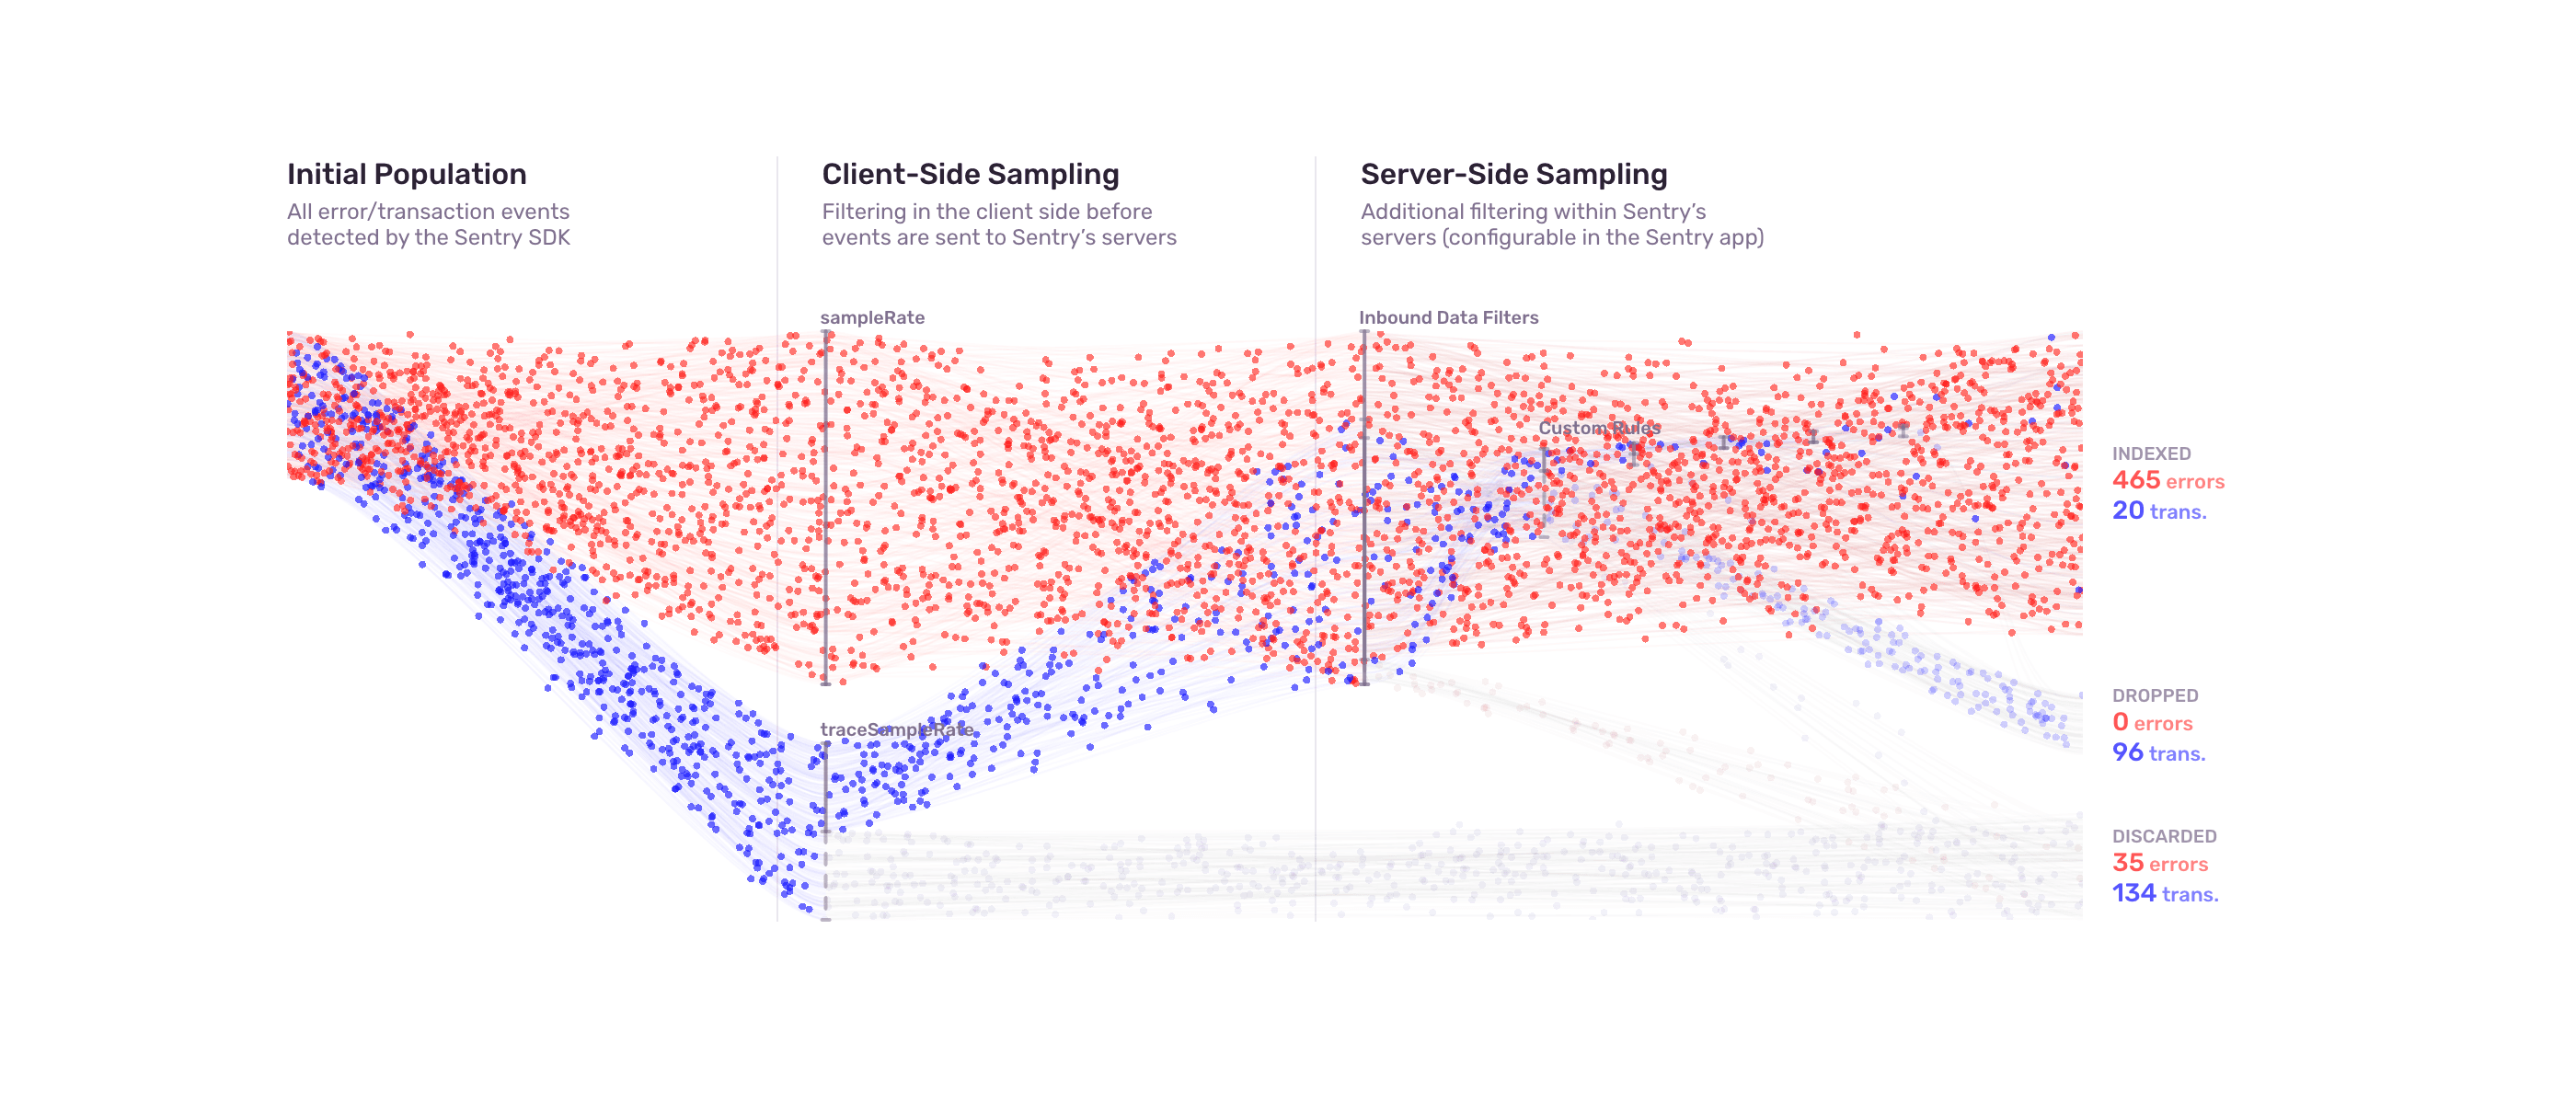
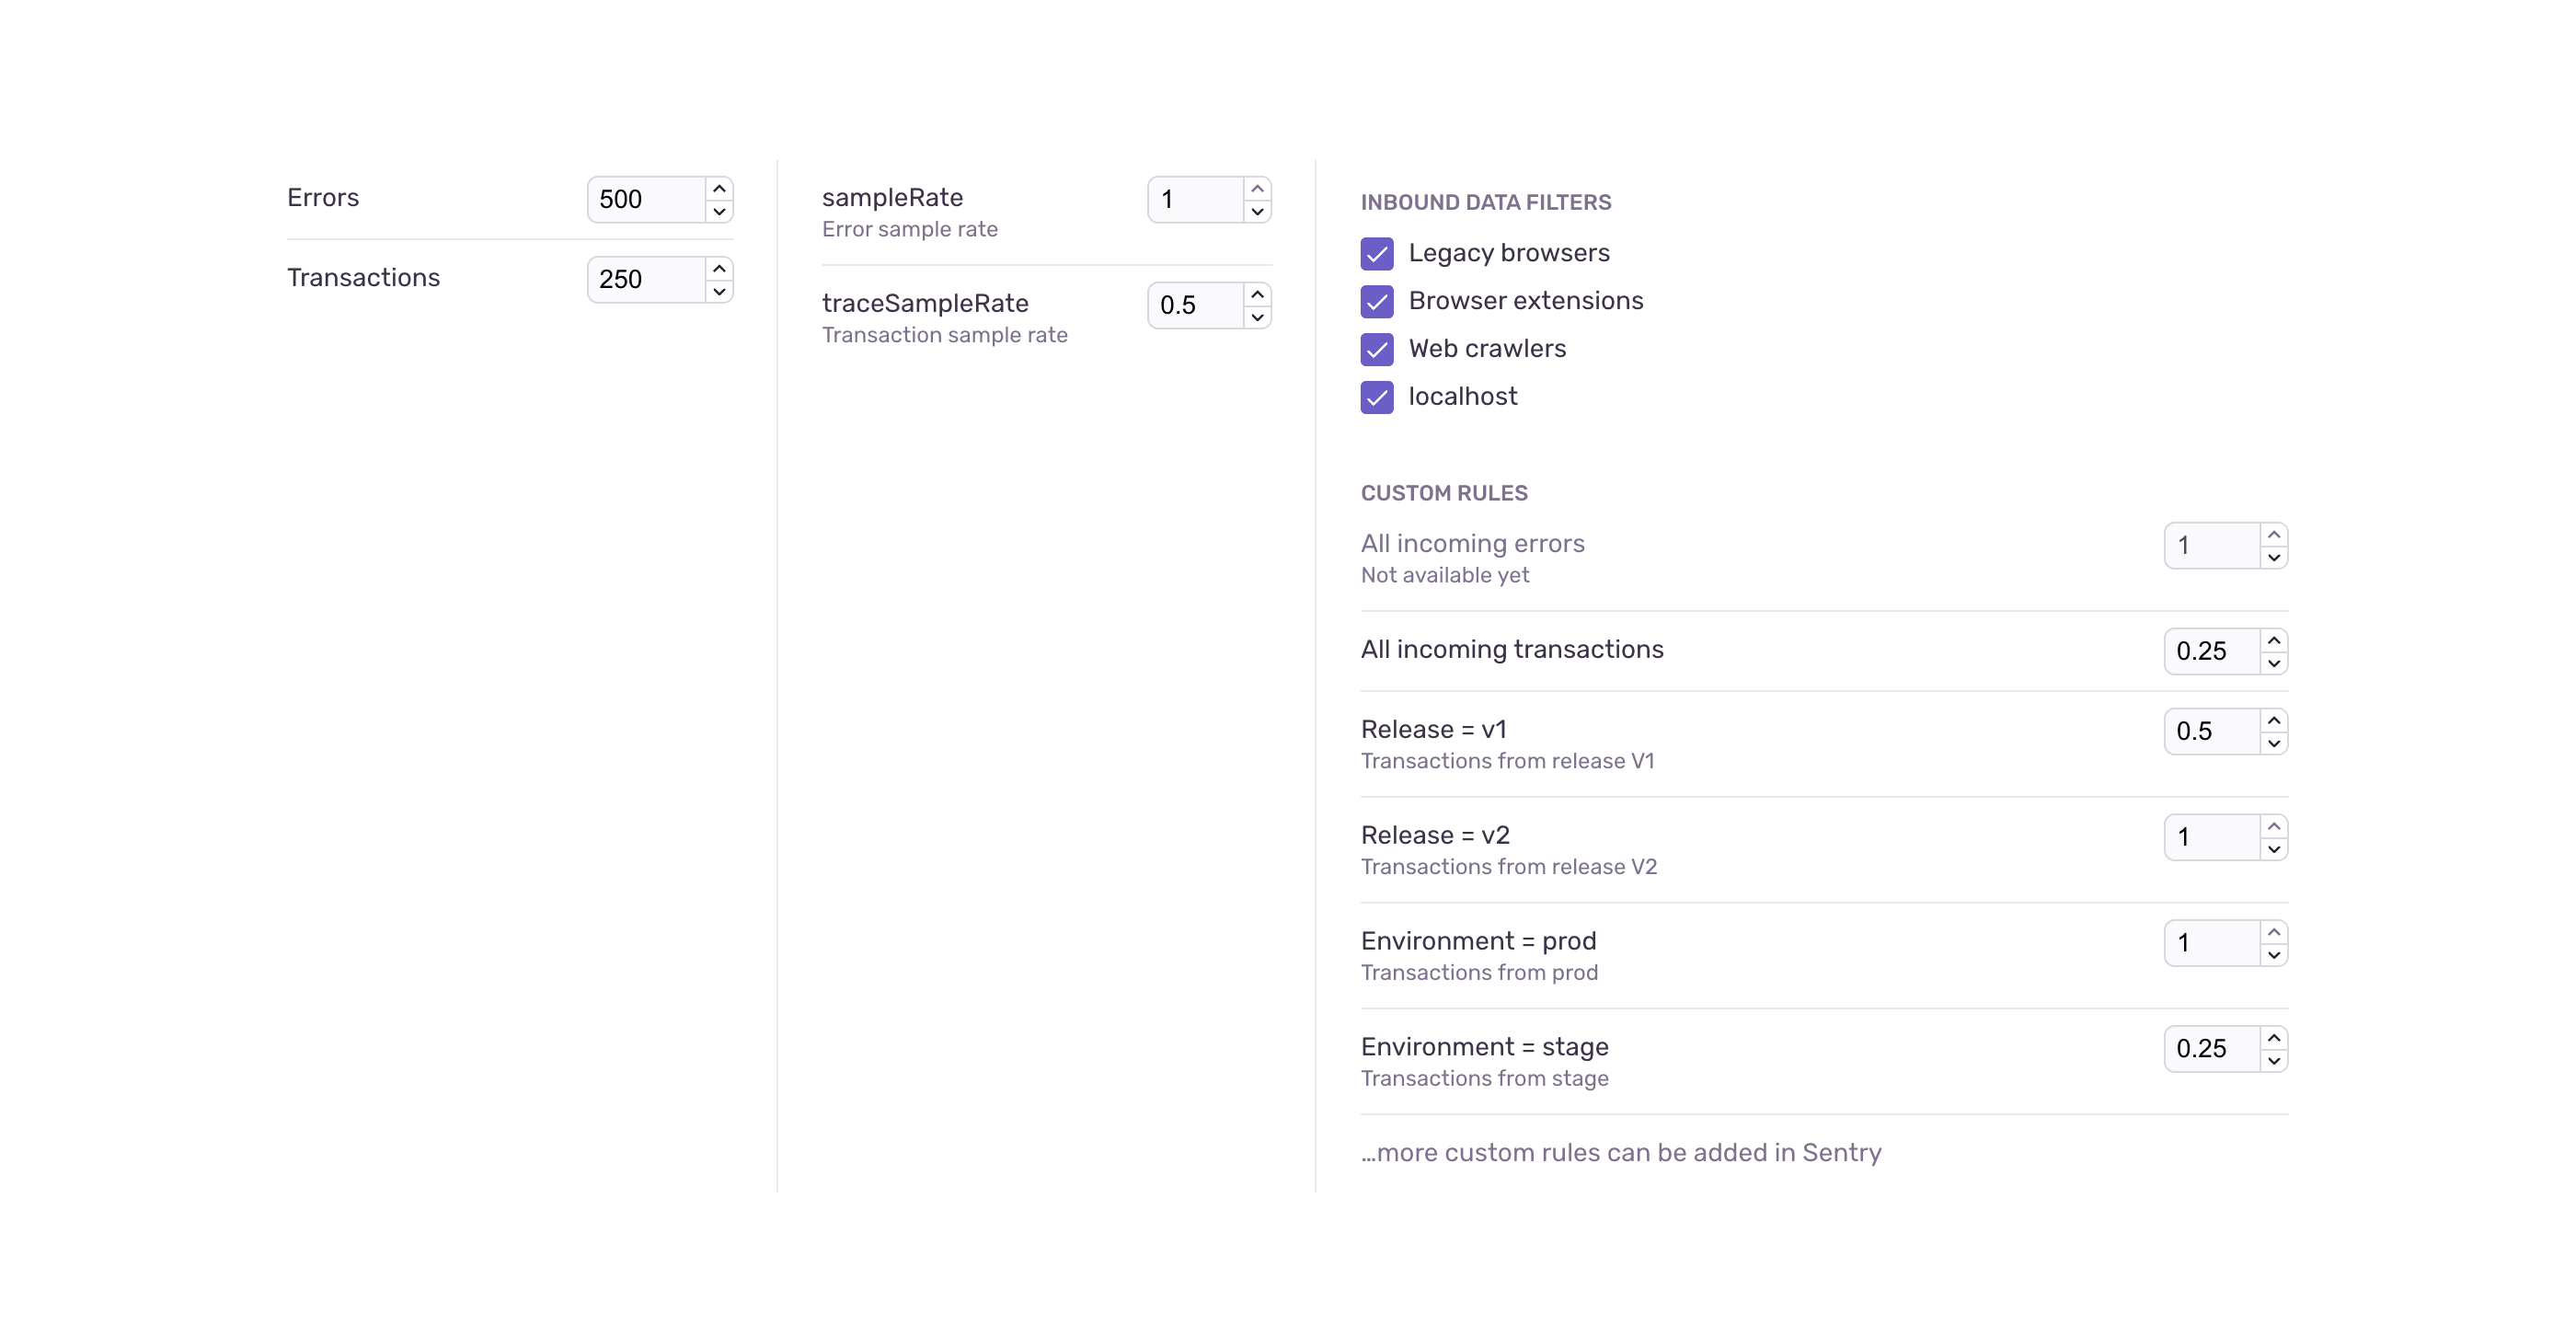
An animated Sankey chart to visualize Sentry’s complex event sampling process.
Events are color-coded based on type and status. The chart is animated to provide a sense of directionality and flow.


An animated Sankey chart to visualize Sentry’s complex event sampling process.
Events are color-coded based on type and status. The chart is animated to provide a sense of directionality and flow.