How COVID-19 Blazed Through the United States
Made in 2020 with Three.js, GSAP, React, and Express
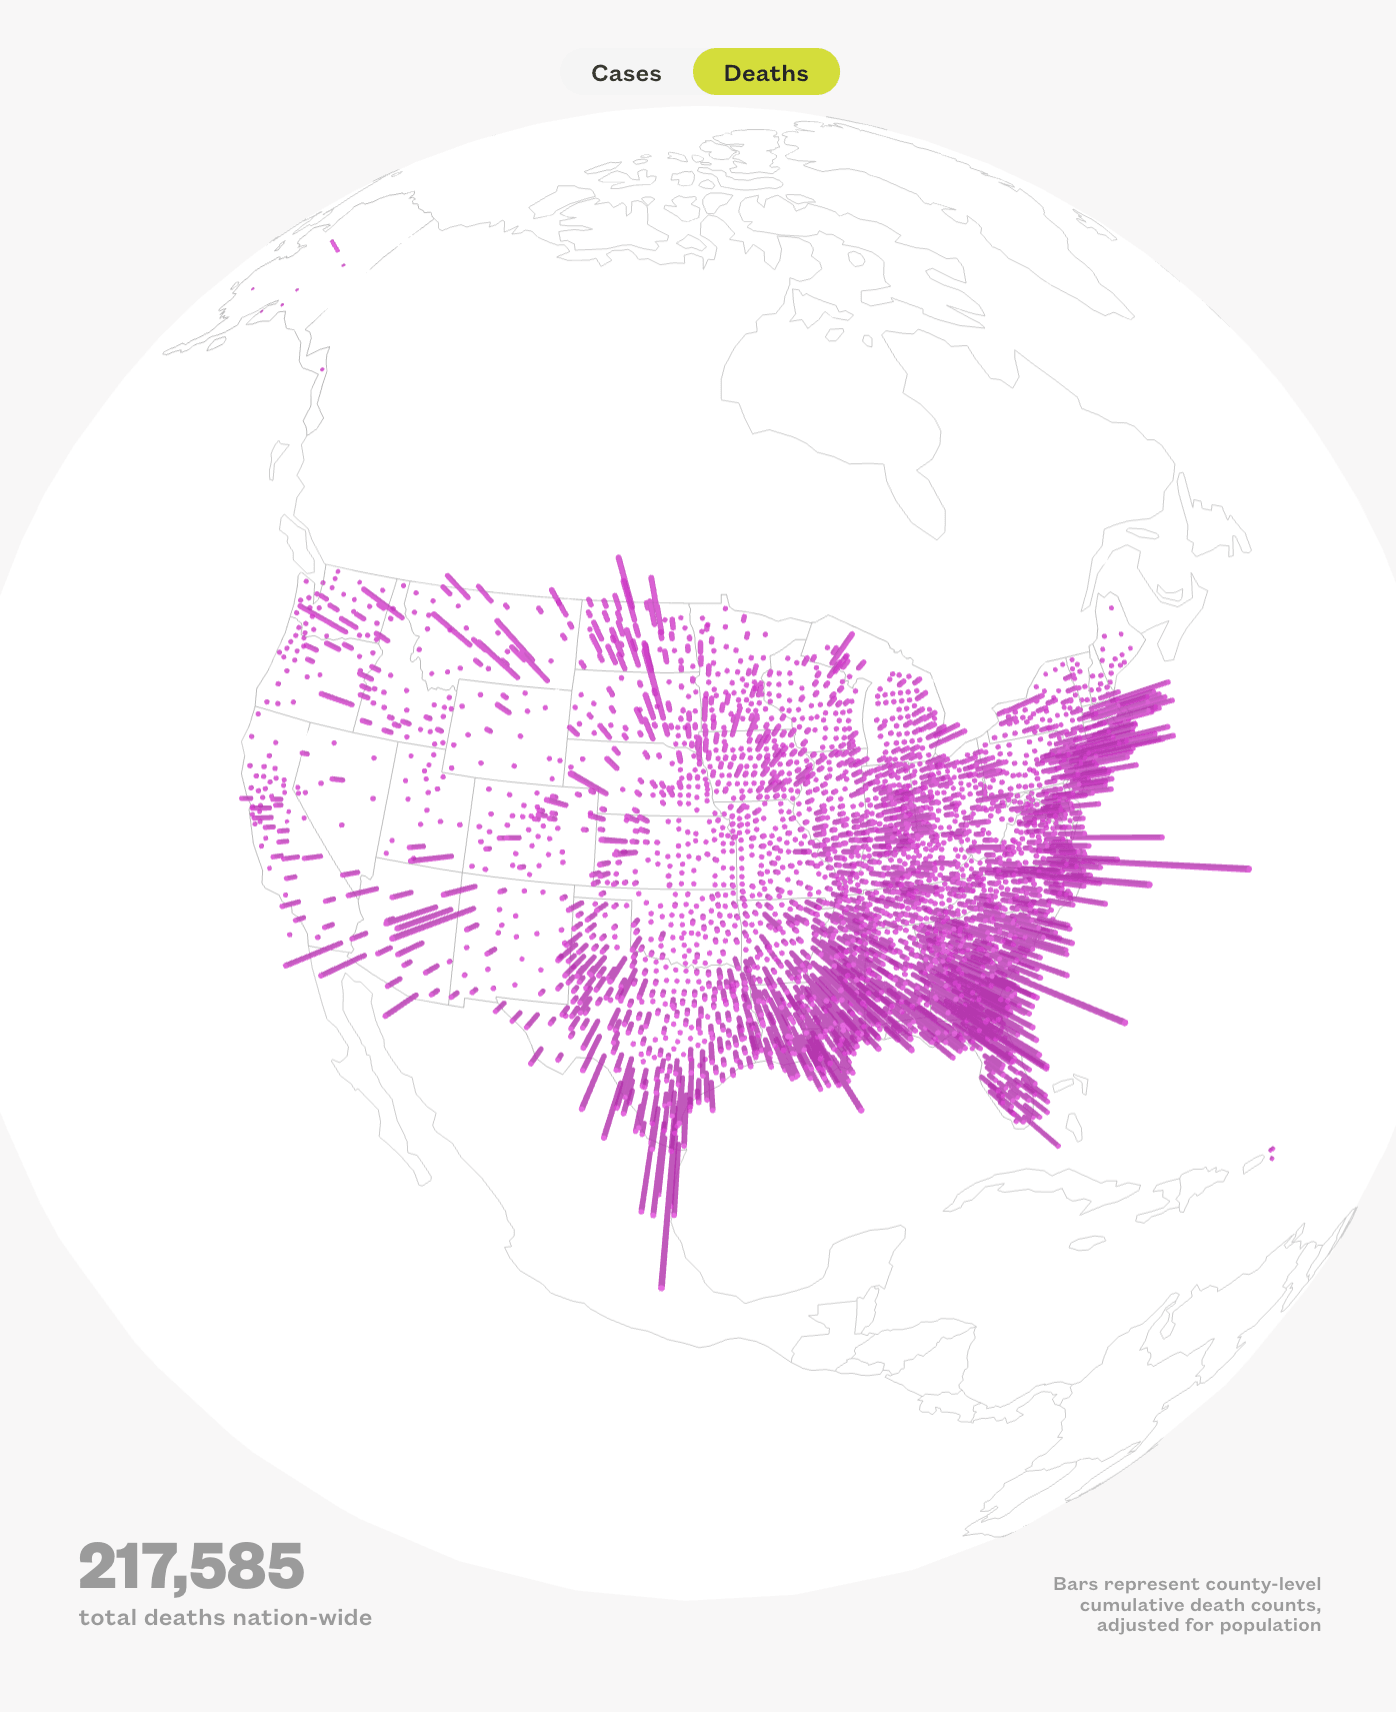
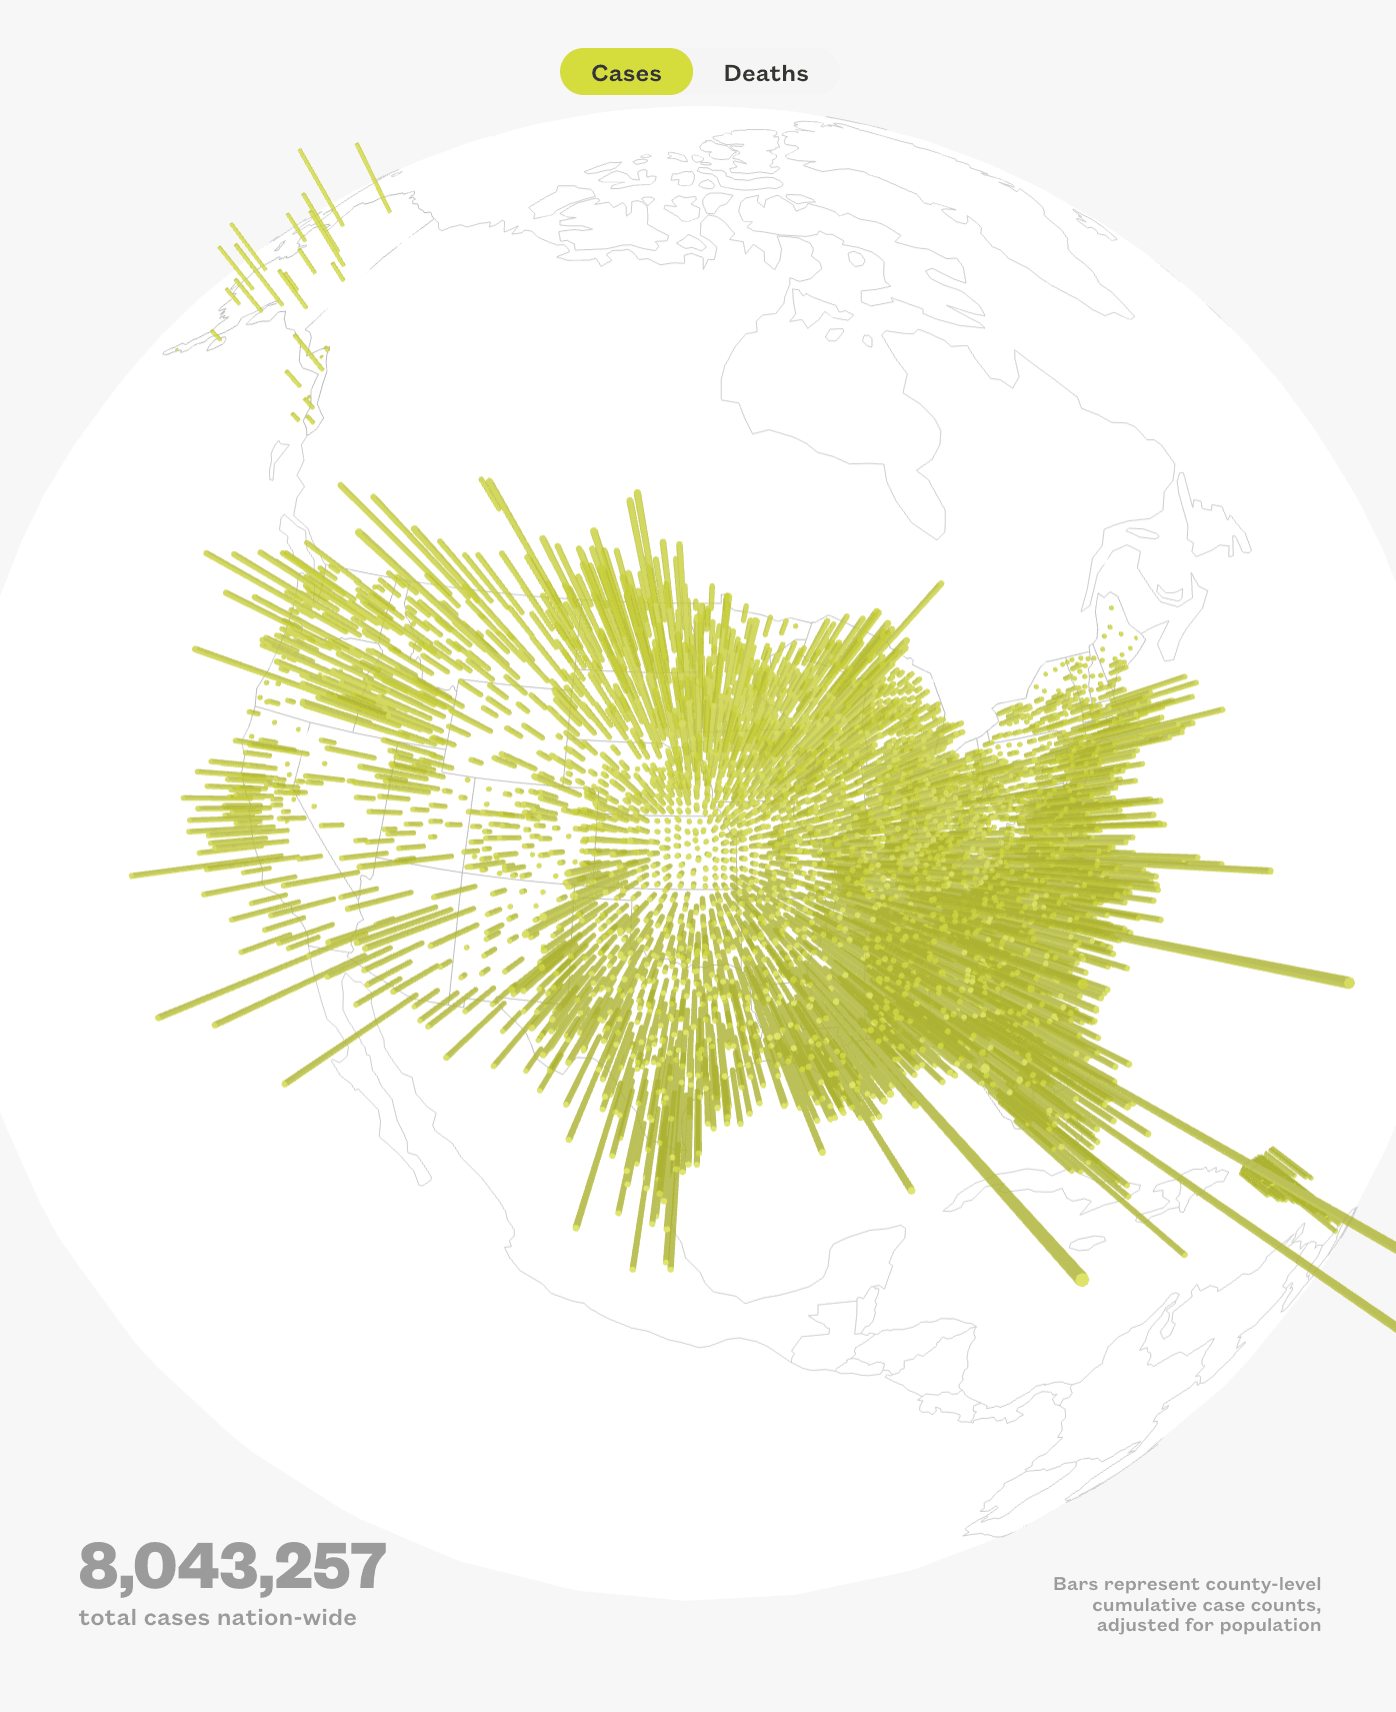
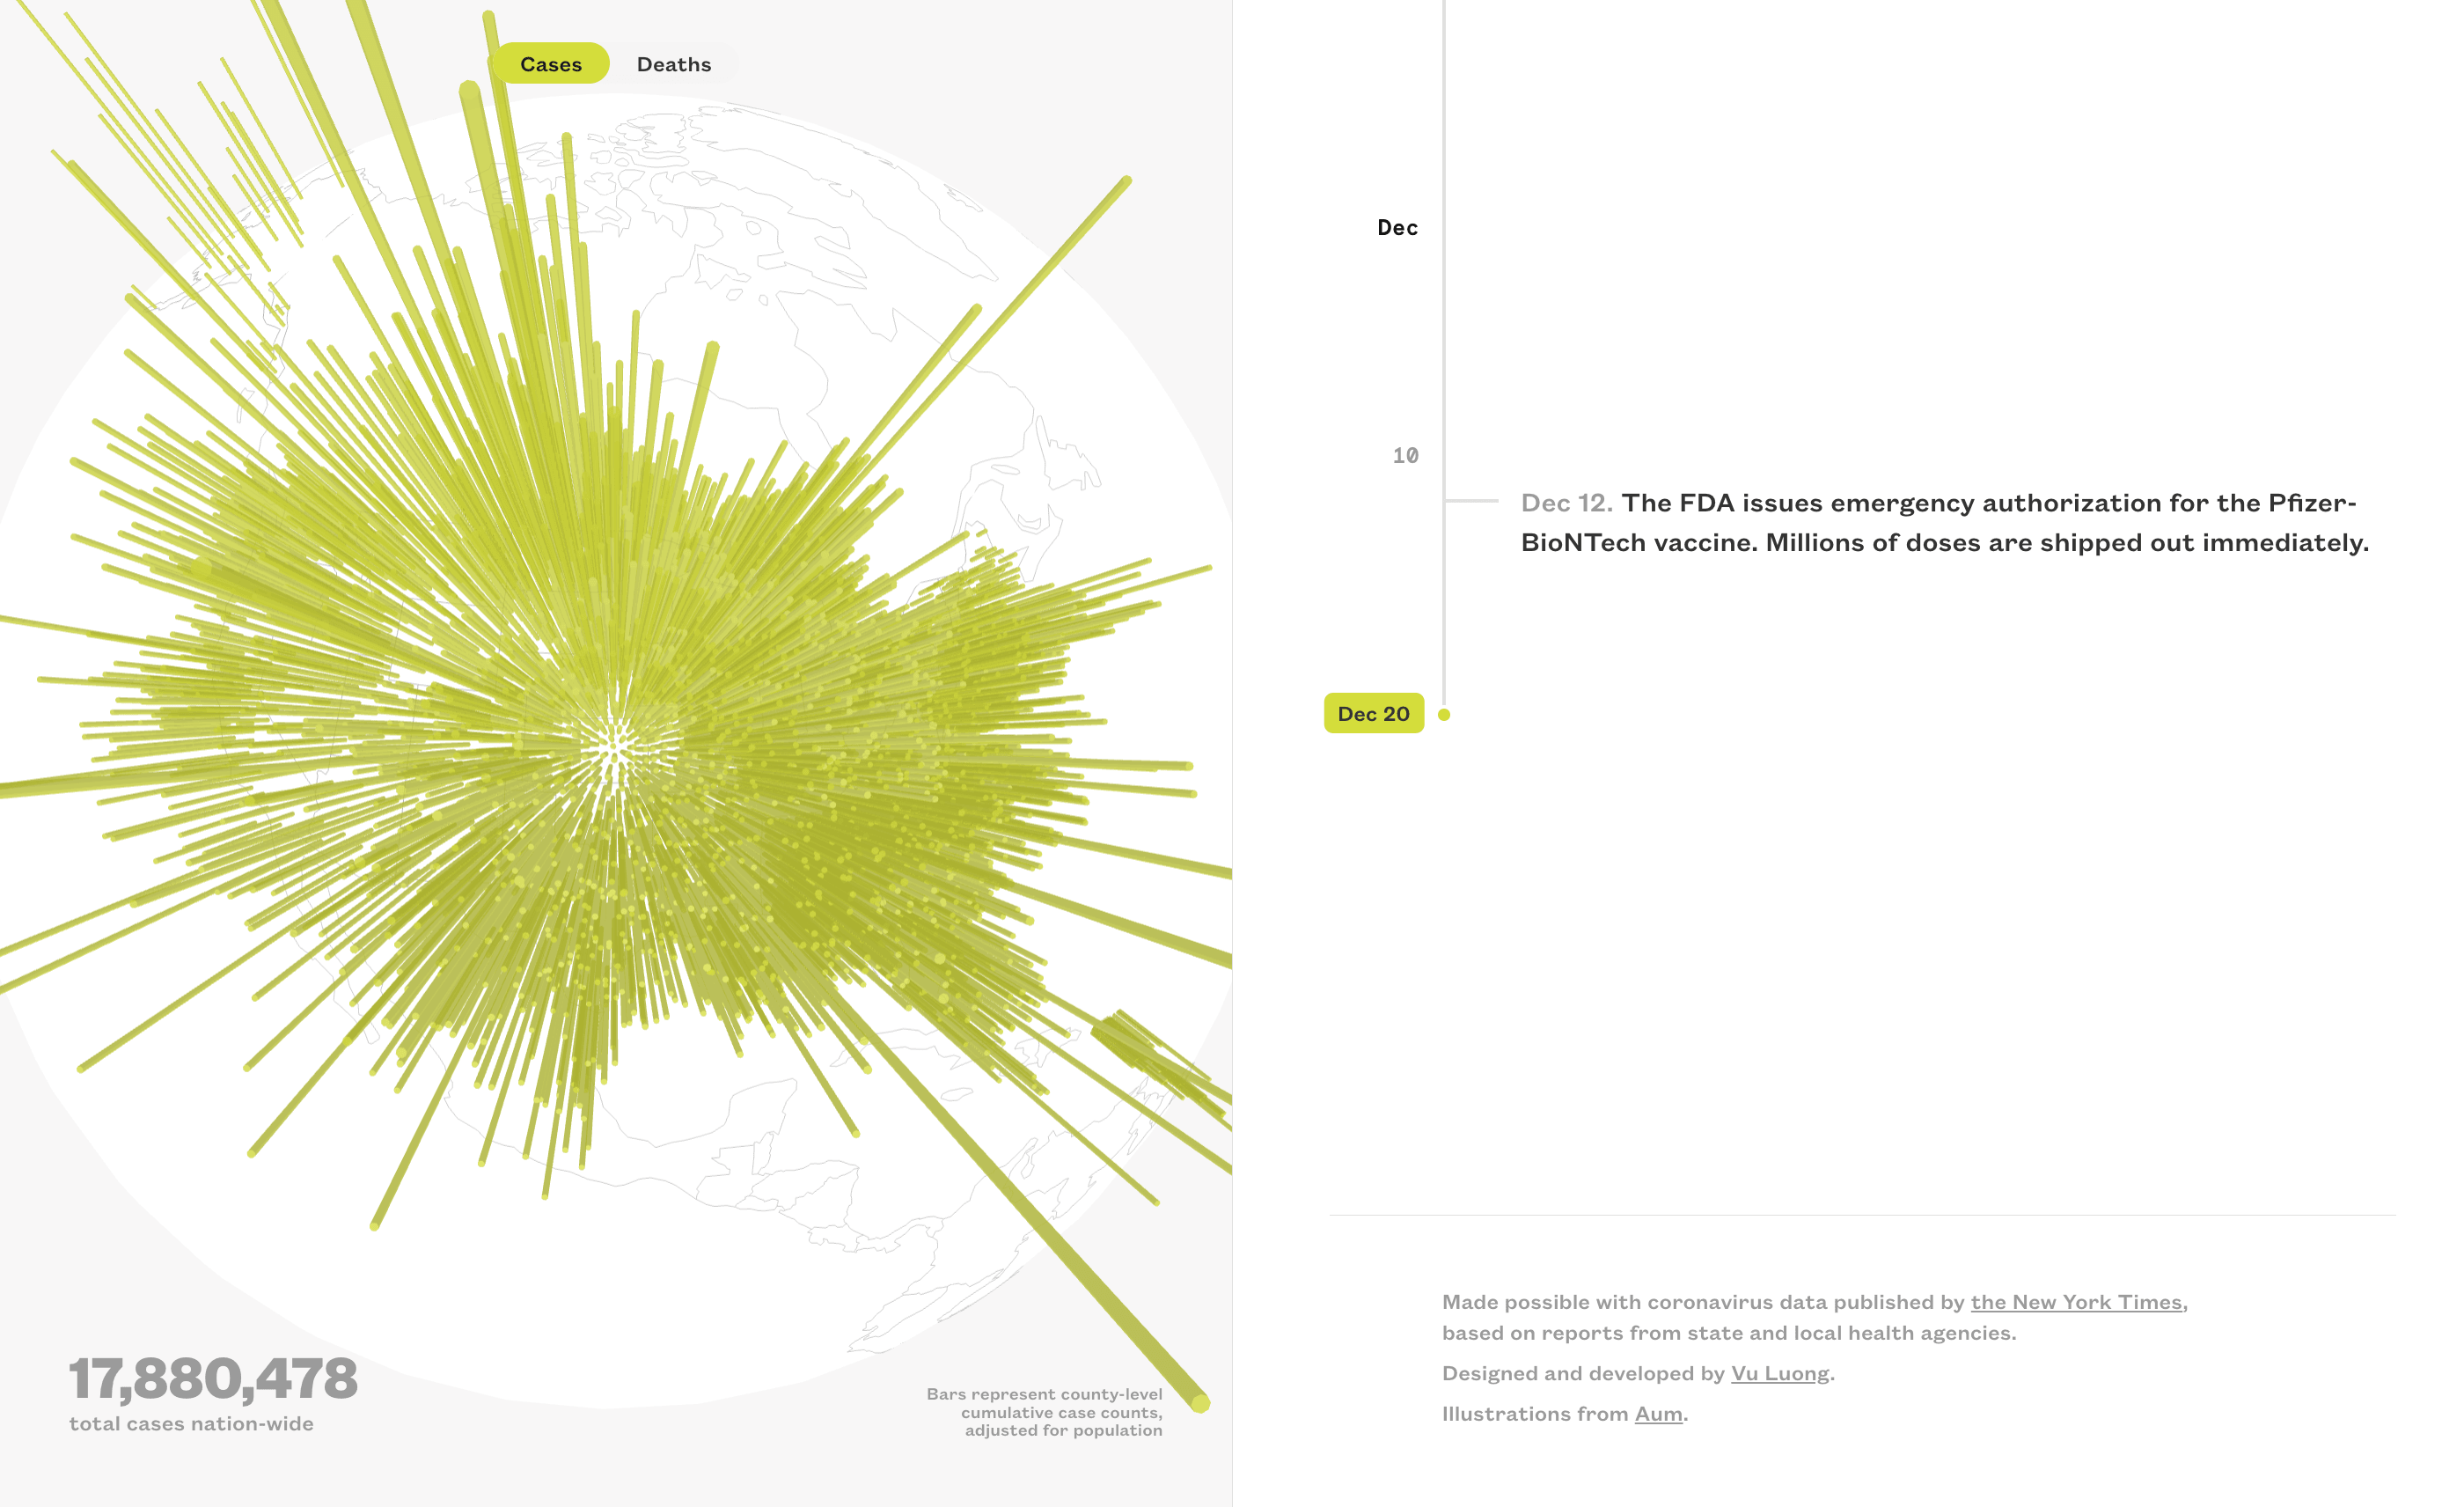
A 3D, scroll-activated data story documenting the coronavirus’s inexorable spread through the United States.
On the left is an interactable 3D earth model with thousands of columns representing county-level case/death counts. On the right is a scrollable timeline marking notable events and landmarks. The two sides move in lockstep, forming a coherent story with relevant statistics and crucial context.


